In the previous post, we used machine learning and regression to create a model to predict house prices using data for houses sold between May 2014 to May 2015 in King County, Washington State, USA.

Predicting house prices with an Artificial Neural Network and Python
When evaluating our regression model, we obtained an R Squared metric of 0.7078 and a root mean squared error (RMSE) of $187,009. The purpose of this blog post is to hopefully improve on those metrics by using an Artificial Neural Network.
An Artificial Neural Network (ANN) is a machine learning algorithm that attempts to simulate the brain by modelling a web of connected nodes and the information transmitted between them, through calculations using different weights and biases between interconnected nodes. Nodes are grouped together in layers, with different transformations taking place at each layer. The features from which we want to predict a result act as the input layer to the ANN, moving through various transformations across hidden layers, before a result is produced at the output layer (usually one or several nodes).
As in our machine learning example (see previous post link above), the Python packages that we will need for this exercise are pandas to work with the data, Matplotlib to provide some visual output and scikit-learn to handle the machine learning algorithms. However, we will also need to install an additional package called keras, to take care of the ANN model calculations and training.
The house price data we will be using is based on housing data for houses sold between May 2014 to May 2015 in King County, Washington State, USA. The data was obtained from here.
The required packages can be downloaded and installed from source at the above links, or installed on the command line using Python’s
pip package manager as follows, which should also install any dependencies (for example tensorflow):pip install pandas pip install matplotlib pip install scikit-learn pip install keras
Now that we have everything installed, let’s get started.
First we need to import the modules that we will be using, which will be described in more detail below as we use each model:
import pandas as pd
import matplotlib.pyplot as plt
from math import sqrt
from keras.layers import Dense
from keras.models import Sequential
from sklearn.metrics import mean_squared_error, r2_score
from sklearn.model_selection import train_test_split
from sklearn.preprocessing import MinMaxScaler
Next we create a pandas dataframe with the housing data CSV file, which is assumed to be in the same directory as the Python script:
data = pd.read_csv("kc_house_data.csv")
To see all the columns in the dataset, issue the command
print(data.columns.values):['id' 'date' 'price' 'bedrooms' 'bathrooms' 'sqft_living' 'sqft_lot' 'floors' 'waterfront' 'view' 'condition' 'grade' 'sqft_above' 'sqft_basement' 'yr_built' 'yr_renovated' 'zipcode' 'lat' 'long' 'sqft_living15' 'sqft_lot15']
Some rows in our data contain strange values, for example a zero value in the number of bathrooms and bedrooms, or an abnormally high number of bedrooms. It may be worthwhile to drop these rows from the data.
# drop data with zero bedrooms and bathrooms and bedrooms outlier
data = data.drop(data[data.bedrooms == 0].index)
data = data.drop(data[data.bedrooms == 33].index)
data = data.drop(data[data.bathrooms == 0].index)
Additionally, the id and date columns are not required, neither is the zip code as we already have longitude and latitude columns for the location data:
# drop columns that we won't be using
data = data.drop(['id', 'date', 'zipcode'], axis=1)
In order for the calculations between nodes to not be biased towards features with large number ranges, we need to perform some preprocessing on the data to scale the inputs to be constrained between 0 and 1. To do this, we use the
MinMaxScaler function, which scales the data by mapping the lowest value for each feature to 0 and the highest value to 1. We place the result in a new dataframe called data_scaled.# scale data to values between 0 and 1 scaler = MinMaxScaler() data_scaled = scaler.fit_transform(data) # numpy array # convert numpy array to dataframe with data columns names data_scaled = pd.DataFrame(data_scaled, columns=data.columns.values)
The target, or dependent variable (
price) needs to be split from the independent variables in the dataset to create two separate data frames:# dependent variable y_scaled = data_scaled[['price']].values # extract independent variables (all columns except price) X_scaled = data_scaled.drop(['price'], axis=1).values
The data then needs to be split into testing and training sets. The training sample data (80% of the data) is used to train the model to identify relationships. The resultant trained model can then be evaluated by predicting target variables from the unseen test data (20% of the data).
# randomly split data into train and test
X_train, X_test, y_train, y_test = train_test_split(X_scaled, y_scaled, test_size = 0.2)
Next, we create our ANN model, consisting of two hidden layers and an output layer, using the
Sequential model from the keras package.x_len = len(X_scaled[0]) model = Sequential([ # dense layer with 32 neurons, relu activation and x_len features Dense(32, activation='relu', input_shape=(x_len,)), # dense layer with 16 neurons and relu activation (constrain to 0 to 1) Dense(16, activation='relu'), # dense output layer with one neuron Dense(1, activation='linear'), ])
There is quite a lot going on in the above code. The first hidden layer has 32 nodes and uses the ReLu activation function. The
input_shape parameter is the number of input parameters, which we extract by calculating the number of columns in the input data (number of features / columns). The second hidden layer has 16 nodes, but we don’t have to repeat the input_shape, as it is assumed to be the same. The output layer has one node and uses a linear activation function.We are now ready to build and train the model.
To build (compile) the model, we have to choose an optimizer and specify a loss function. The Adam optimizer has worked well for me, but you may want to experiment with some others. For regression type problems, the mean squared error is a common choice for the loss function, as it penalises higher error values.
# build the model
model.compile(optimizer='adam',
	loss='mean_squared_error')
To train (fit) the model, we pass in the independent variable samples from the training data (
X_train) and the dependent variable training data (y_train), as well as the batch size (training examples per iteration) and the number of epochs (iteration count of passes over training set). The data against which the training will be validated (test data) is also passed into the function.# train model hist = model.fit(X_train, y_train, batch_size=32, epochs=50, validation_data=(X_test, y_test))
Now that the model has been trained, it’s time to make some predictions using the test data and compare these results to the expected values in order to evaluate the model. We use R squared and root mean squared error (RMSE) to test the effectiveness of our model:
# make some predictions using the model
y_pred = model.predict(X_test)
# evaluate model based on the predictions
print ('Model evaluation:')
print ('R squared:t {}'.format(r2_score(y_test, y_pred)))
# calculate RMSE based on unscaled value
rmse = sqrt(mean_squared_error(y_test, y_pred)) * (data['price'].max() - data['price'].min())
print ('RMSE:tt {}'.format(rmse))
The output of the above will vary each time you run the model. My output was as follows:
Model evaluation:
R squared:	 0.8766830328007977
RMSE:		 134796.12277840523
The R squared score, which tells us that approximately 87.67% of variations in house prices are explained by the independent variables (inputs), is quite a bit better than the score obtained in the previous blog post using machine learning regression. The RMSE of $ 134,796 is also a decent improvement, although still not ideal since the mean of the house prices in the dataset is in the region of $540,000.
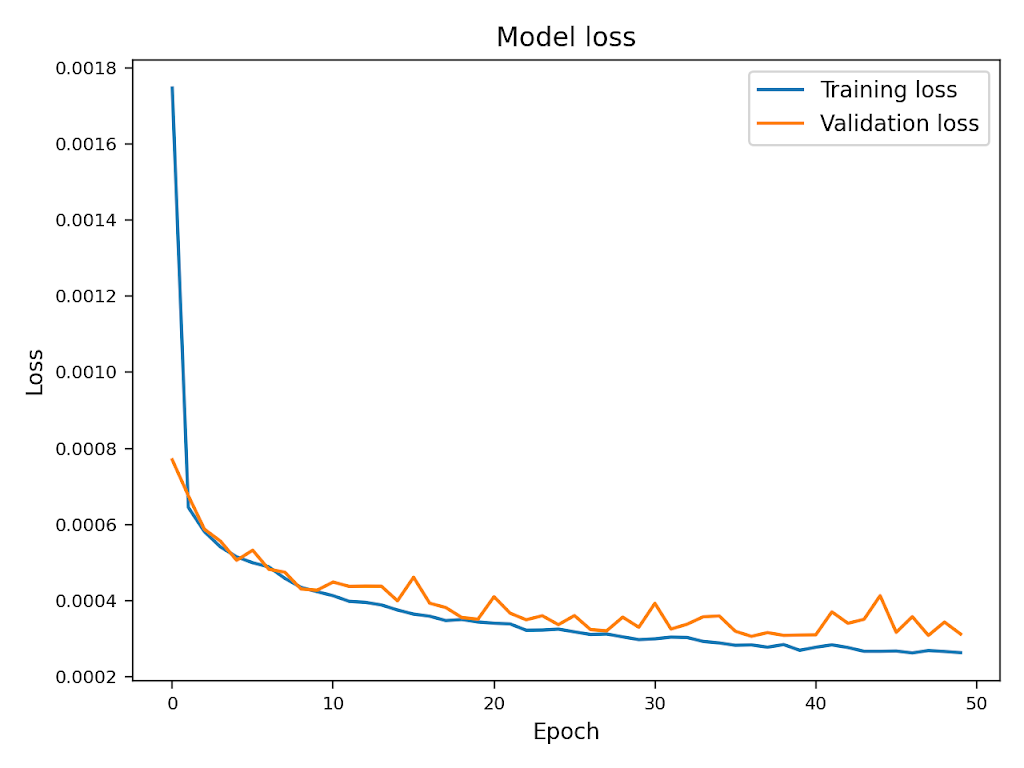
We can visualise the history of the training process by mapping the training loss against the validation loss.
# visualise loss during training
plt.plot(hist.history['loss'])
plt.plot(hist.history['val_loss'])
plt.title('Model loss')
plt.ylabel('Loss')
plt.xlabel('Epoch')
plt.legend(['Training loss', 'Validation loss'], loc='upper right')
plt.tick_params(labelsize=8)
plt.tight_layout()
plt.show()
The model can probably be further improved by experimenting with some of the design elements, such as the configuration of hidden layers, or by implementing regularisation to fine tune the model.
All of the above code can be found on my Github page.