
One of the biggest areas for potential growth in the future of small businesses is the use of artificial intelligence (AI) to assist in decision making, risk assessment, marketing, logistics and prediction of business outcomes. It may not be obvious, but AI is already used extensively by large global corporates for quite some time now, with use cases in shopping and entertainment recommendations, driving aids and search algorithms, to name but a few.
AI is broadly defined as the simulation of human intellect by computers, and has many diverse applications in business and computer science.
Machine Learning (ML) is a subset of AI, which aims to develop algorithms which allow computers to learn from experience. Sample data is used to train and test the model, with the aim teaching the system to make meaningful predictions on real world data.
Machine learning problems come in various types, depending on the type of problem to be solved. For example, classification problems aim to allocate labels to data, while clustering is an unsupervised learning outcome that groups data based on common features.
For this example, we will be looking at a regression problem, where we will look at training a model to predict house values based on known features, such as the number of bedrooms, living area and location.
The Python packages that we will need for this exercise are pandas to work with the data, Matplotlib to provide some visual output and scikit-learn to handle the machine learning.
The house price data we will be using is based on housing data for houses sold between May 2014 to May 2015 in King County, Washington State, USA. The data was obtained from here.
The required packages can be downloaded and installed from source at the above links, or installed at the command line using Python’s
pip package manager as follows:pip install pandas pip install matplotlib pip install scikit-learn
Now that we have everything installed, let’s get started.
First we need to import the modules that we will be using. We’ll be using scikit-learn linear regression to build our ML model, which we will evaluate using R squared and root mean squared error (RMSE).
import pandas as pd
import matplotlib.pyplot as plt
from math import sqrt
from sklearn.linear_model import LinearRegression
from sklearn.metrics import mean_squared_error, r2_score
from sklearn.model_selection import train_test_split
Next we create a pandas dataframe with the house data CSV file, which is assumed to be in the same directory as the Python script:
data = pd.read_csv("kc_house_data.csv")
Issuing the command
print(data.columns.values) shows the following list of column names, most of which are self explanatory:['id' 'date' 'price' 'bedrooms' 'bathrooms' 'sqft_living' 'sqft_lot' 'floors' 'waterfront' 'view' 'condition' 'grade' 'sqft_above' 'sqft_basement' 'yr_built' 'yr_renovated' 'zipcode' 'lat' 'long' 'sqft_living15' 'sqft_lot15']
Some rows in our data contain strange values, for example a zero value in the number of bathrooms and bedrooms, or an abnormally high number of bedrooms. It may be worthwhile to drop these rows from the data.
# drop data with zero bedrooms and bathrooms and bedrooms outlier
data = data.drop(data[data.bedrooms == 0].index)
data = data.drop(data[data.bedrooms == 33].index)
data = data.drop(data[data.bathrooms == 0].index)
Additionally, the id and date columns are not required, neither is the zip code as we already have longitude and latitude columns for the location data:
# drop columns that we won't be using
data = data.drop(['id', 'date', 'zipcode'], axis=1)
The different features (columns) of the data can be tested against the price (target) to see how well they are correlated, by using the
corr function. We place the results in a dictionary object:# create a dictionary of how features correlate to house prices
correlations = {}
for column in data.loc[:, 'bedrooms':].columns:
correlations[column] = data[column].corr(data['price'])
We can perform some simple visual analysis on the correlation data, and also look at the grouping of a specific feature, for example the number of bedrooms (We don’t provide any explanation for this code, as data visualisation is not the focus of this exercise):
# setup grid for charts
fig, (ax1, ax2) = plt.subplots(1, 2)

# bar plot of correlations of features to price
ax1.bar(correlations.keys(), correlations.values())
ax1.title.set_text('Feature correlations')
ax1.set_ylabel('Correlation')
ax1.tick_params(labelrotation=90, labelsize=8)

# bar plot of most common number of bedrooms
x = data['bedrooms'].value_counts()
ax2.bar(x.index, x)
ax2.title.set_text('Number of bedrooms')
ax2.set_xlabel('Bedrooms')
ax2.set_ylabel('Count')
ax2.tick_params(labelsize=8)

# plot charts
fig.tight_layout()
plt.show()
The resulting charts should look something like the below:
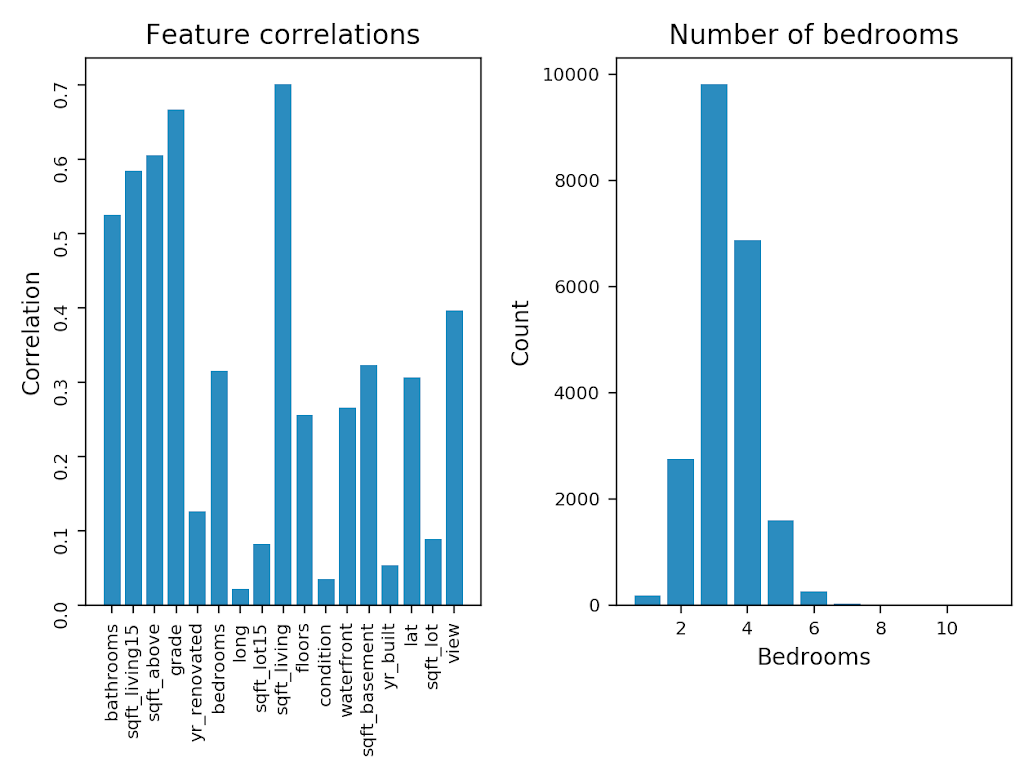
As can be seen, some of the features have a fairly strong correlation with the price (target variable). Let’s investigate this relationship further through a scatter plot for some of the features:
# setup grid for charts
fig, ((ax1, ax2), (ax3, ax4)) = plt.subplots(2, 2, sharey=True)

# scatter plots of selected features vs price
ax1.scatter(data['bedrooms'], data['price'])
ax1.title.set_text('bedrooms')
ax2.scatter(data['bathrooms'], data['price'])
ax2.title.set_text('bathrooms')
ax3.scatter(data['sqft_living'], data['price'])
ax3.title.set_text('sqft_living')
ax4.scatter(data['grade'], data['price'])
ax4.title.set_text('grade')

# set label size for all subplots
for ax in fig.get_axes():
    ax.tick_params(labelsize=8)

# plot charts
plt.suptitle('Features vs price')
fig.tight_layout()
plt.show()
The above code creates the following scatter plots:

Now let’s get started with the ML model…
We will be using Linear Regression to build a ML model, with a goal to predict house prices based on the features in the dataset. The target variable (price) is known as the dependent variable and the different features in the dataset are known as the independent variables. The target variable needs to be split from the independent variables in the dataset to create two separate data frames:
# dependent variable
y = data['price']

# extract independent variables (all columns except price)
X = data.drop(['price'], axis=1)
The data then needs to be split into testing and training sets. The training sample data (80% of the data) is used to train the model to identify relationships through linear regression. The resultant trained model can then be evaluated by predicting target variables from the unseen test data (20% of the data).
# randomly split data into train and test
X_train, X_test, y_train, y_test = train_test_split(X, y,
                                                    test_size = 0.2,
                                                    random_state=10)
Once we have evaluated the model (see further below), the
random_state variable can be adjusted to a different value, in order to try and fine tune the model accuracy.The linear regression model can now be built and trained (fitted), based on our training dataset:
# initialise linear regression
reg = LinearRegression()

# fit training data
reg.fit(X_train, y_train)
Now let’s make some predictions using the test data and compare these results to the expected values in order to evaluate the model. To test the effectiveness of our model, we use R squared and root mean squared error (RMSE):
# evaluate model
y_pred = reg.predict(X_test)
print ('Model evaluation:')
print ('R squared:t {}'.format(r2_score(y_test, y_pred)))
print ('RMSE:tt {}'.format(sqrt(mean_squared_error(y_test, y_pred))))
The resultant output should give something along the following lines:
Model evaluation:
R squared:	 0.70784634093
RMSE:		 187009.023014
The R squared score tells us that approximately 70% of variations in house prices are explained by the independent variables (inputs), which is not too bad for a first try without any additional model tuning. However, the RMSE of $ 187,009 is a fairly high error value, given that the mean of the house prices in the dataset is in the region of $ 540,000.
Neither of these outcomes are ideal if the model was to be used in production for making any real world predictions, but this can provide a good base model for comparing against alternate ML models after additional tuning methods, such as gradient boosting are applied, or a neural network regression model based on the same data.
In a future post we will be looking at whether we can improve our results by building a model using an artificial neural network.
As always, the full code for the above exercise can be found on Github.